
egg osmosis lab report pdf
- Published
- in PDF
Egg osmosis experiments vividly demonstrate the principles of diffusion and semi-permeable membranes, often documented in detailed lab reports. These reports analyze how varying sucrose concentrations impact egg size.
Purpose of the Experiment
The primary goal of this egg osmosis experiment is to observe and quantify the effects of different sucrose solutions on a deshelled egg, serving as a model for cellular membrane behavior. Specifically, we aim to investigate how varying concentrations of sucrose – a hypertonic environment – influence water movement across the egg’s semi-permeable membrane via osmosis.
This investigation seeks to demonstrate the principles of diffusion and osmotic pressure, allowing students to visualize and measure changes in egg mass and diameter. By carefully controlling variables and collecting quantitative data, we intend to establish a clear relationship between sucrose concentration and the rate of water transfer. Ultimately, this lab provides a practical understanding of biological processes occurring within cells and their surrounding environments.
Background on Osmosis
Osmosis is a specific type of diffusion, focusing on the movement of water molecules across a selectively permeable membrane from an area of high water concentration to one of low water concentration. This process aims to equalize the water potential on both sides of the membrane. The direction of water movement is dictated by differences in solute concentration; water travels towards the area with higher solute concentration.
A hypertonic solution has a higher solute concentration than the cell’s interior, causing water to exit the cell, leading to shrinkage. Conversely, a hypotonic solution has a lower solute concentration, causing water to enter the cell, potentially leading to swelling or bursting. Understanding these principles is crucial for comprehending cellular function and maintaining homeostasis within living organisms.
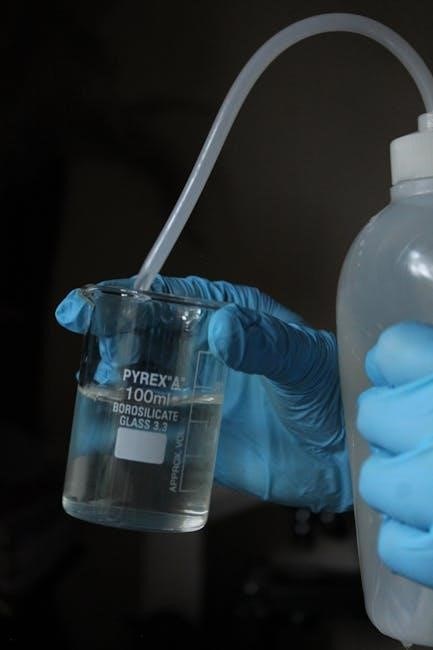
Materials and Methods
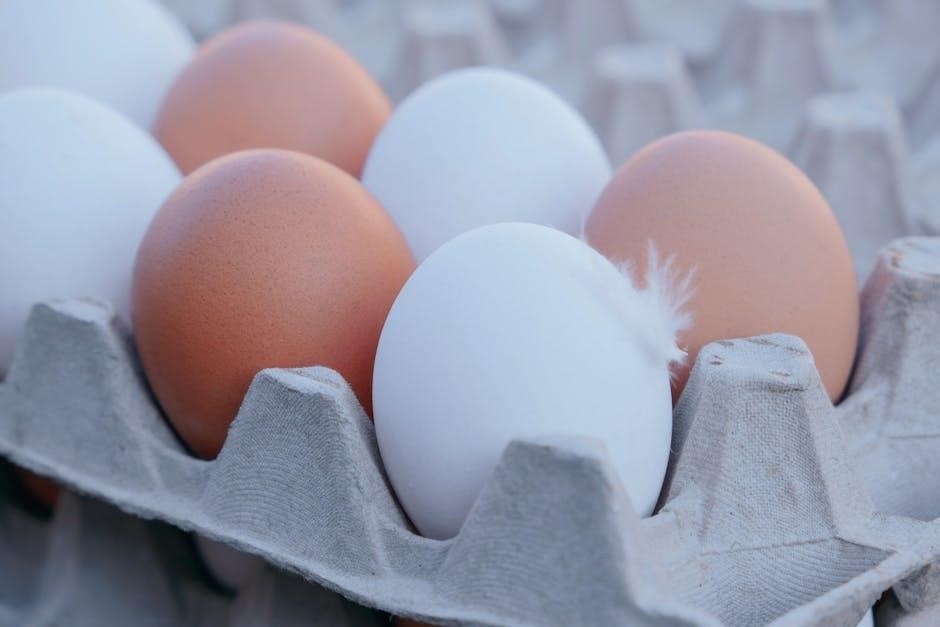
This experiment utilized deshelled eggs, various sucrose solutions, beakers, and precise measuring tools to track changes in egg mass and diameter over time.
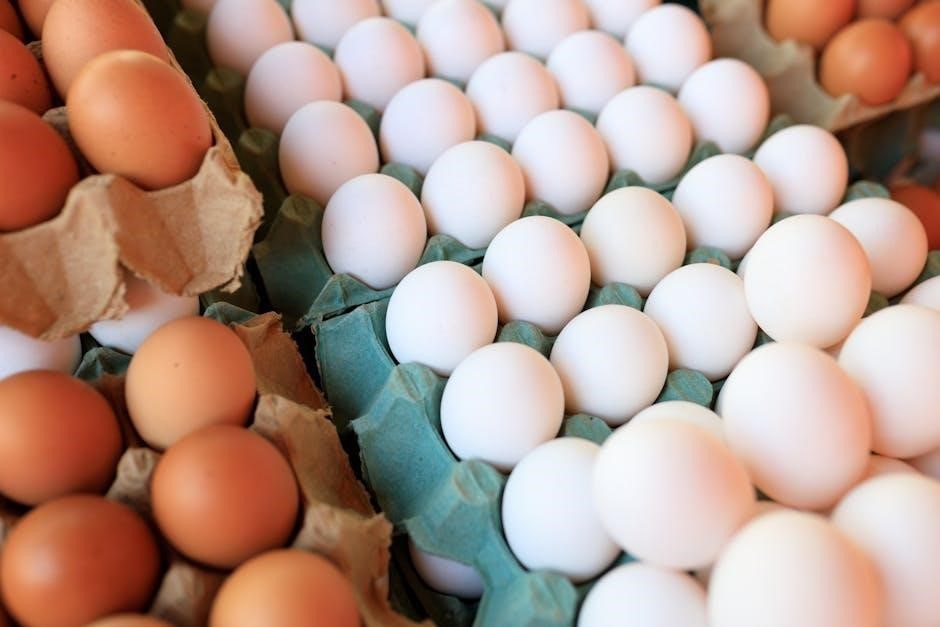
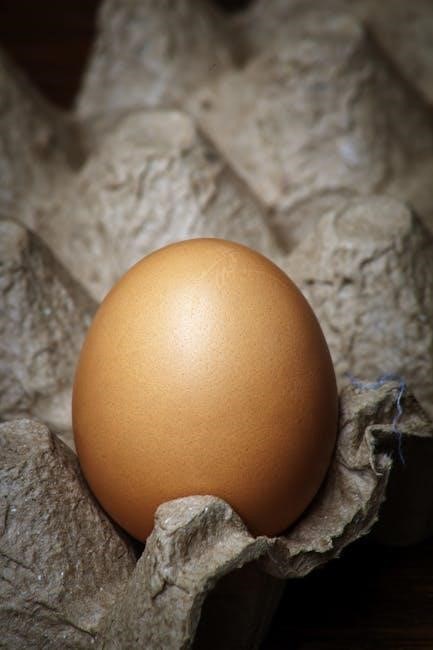
Egg Preparation (Deshelling Process)
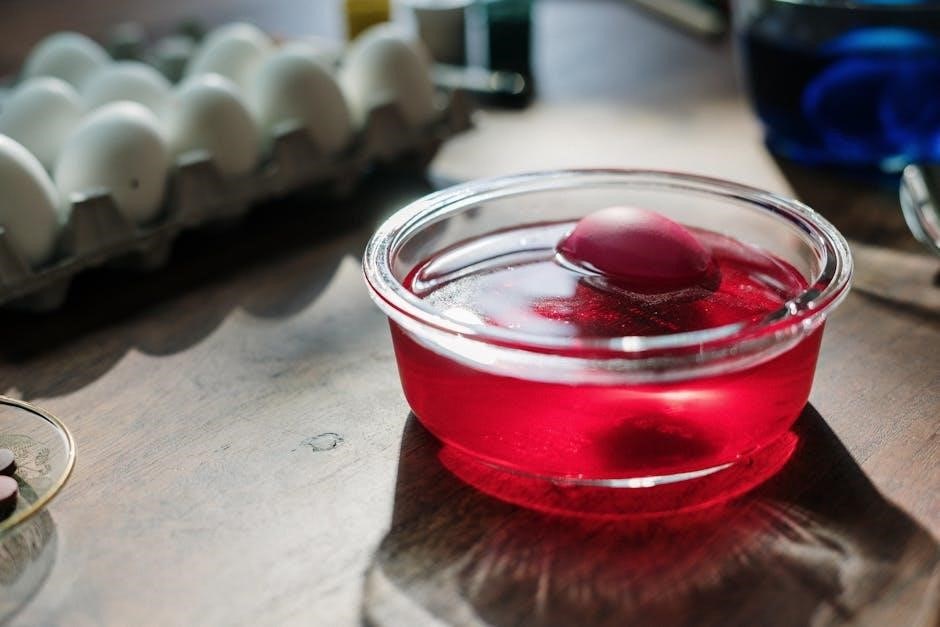
Initially, raw eggs were carefully submerged in vinegar (acetic acid) for approximately 24-48 hours. This process gradually dissolved the calcium carbonate shell, leaving behind the semi-permeable egg membrane intact. Frequent gentle agitation ensured uniform shell removal.
The vinegar was replaced multiple times during this period to maintain its effectiveness and prevent saturation with calcium carbonate. Once the shell completely dissolved, the eggs were gently rinsed with water to remove any residual vinegar.
Care was taken during rinsing to avoid rupturing the delicate membrane. The resulting deshelled eggs appeared translucent and slightly swollen, ready for immersion in varying sucrose solutions for observation of osmotic effects.
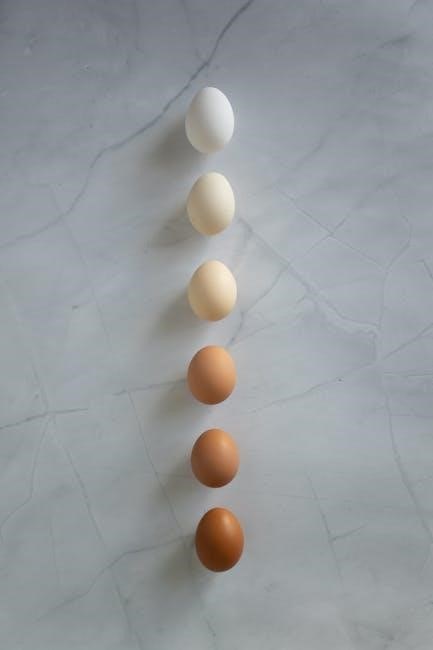
Solutions Used (Sucrose Concentrations)
A series of sucrose solutions were prepared with varying molarities to investigate their impact on osmosis. These included 0.0M (distilled water – hypotonic), 0.2M, 0.4M, 0.6M, 0.8M, and 1.0M sucrose solutions (hypertonic).
Each solution was created by accurately weighing sucrose and dissolving it in a measured volume of distilled water, ensuring complete dissolution through stirring. Precise measurements were crucial for reliable results.
The different concentrations represented a gradient of osmotic potential, allowing for observation of water movement across the egg membrane. These solutions provided the necessary conditions to observe changes in egg mass and diameter, demonstrating the principles of osmosis effectively;
Experimental Setup (Cups and Timeframe)
The experiment utilized six identical beakers or cups, each meticulously labeled to correspond with the different sucrose concentrations – including the control (0.0M). Each deshelled egg was carefully submerged in its assigned solution, ensuring complete coverage.

The setup was maintained at a consistent room temperature, approximately 20-25°C, to minimize temperature-related variables. The timeframe for observation spanned 24 hours, with measurements taken at 0, 6, 12, and 24-hour intervals.
This extended timeframe allowed for sufficient observation of osmotic changes. Regular visual inspections were also conducted to note any changes in egg appearance, complementing the quantitative data collected.
Data Collection – Initial Measurements
Prior to immersion in sucrose solutions, meticulous initial measurements were crucial for accurate analysis. Each deshelled egg underwent careful assessment of both mass and diameter. Mass was determined using an electronic balance, recording values to the nearest 0.01 gram, ensuring precision.
Egg diameter was measured at the widest point using digital calipers, also recorded to two decimal places. These baseline measurements served as the control for calculating subsequent percentage changes.
Multiple measurements (at least three) were taken for each egg and averaged to minimize random errors. Detailed records were maintained in a data table, clearly labeling each egg and its corresponding initial values.
Egg Mass Measurement
Accurate egg mass determination was a cornerstone of this experiment, utilizing a calibrated digital balance. Each egg, before and after immersion in sucrose solutions, was carefully weighed. Initial mass provided a baseline, while subsequent measurements tracked changes due to osmosis.
The balance was zeroed before each measurement to eliminate tare weight. Readings were recorded to the nearest 0.01 gram, ensuring precision. Any visible moisture on the egg’s surface was gently blotted dry before weighing to avoid inaccuracies.
Mass changes were a primary indicator of water movement across the egg’s semi-permeable membrane, directly reflecting the osmotic gradient.
Egg Diameter Measurement
Precise egg diameter measurements complemented the mass data, providing a comprehensive assessment of osmotic effects. A digital caliper was employed to measure the egg’s widest point, ensuring consistent methodology across all time points.
Measurements were taken along two perpendicular axes, and the average was recorded to minimize error. The caliper was carefully applied, avoiding excessive pressure that could distort the egg’s shape. Readings were documented to the nearest 0.01 millimeter.
Changes in diameter, alongside mass, indicated the extent of water influx or efflux, revealing the egg’s response to varying solution tonicities.
Results and Observations
Observed changes in egg mass and diameter correlated directly with sucrose concentration; eggs in hypotonic solutions increased in size, while those in hypertonic solutions decreased.
Changes in Egg Mass Over Time
Monitoring egg mass throughout the experiment revealed crucial insights into osmotic processes. Initially, eggs exhibited a consistent mass, serving as a baseline for comparison. As time progressed, eggs immersed in hypotonic solutions – those with lower solute concentrations than the egg’s interior – consistently gained mass. This increase stemmed from water moving across the semi-permeable membrane into the egg, attempting to equalize the solute concentrations.
Conversely, eggs placed in hypertonic solutions – higher solute concentrations – experienced a decrease in mass. Water exited the egg to balance the external environment. The rate of mass change wasn’t linear; it slowed as equilibrium approached. Precise measurements at regular intervals (e.g., 30, 60, 90 minutes) were essential for accurate data analysis and charting these trends, demonstrating osmosis’s dynamic nature.
Changes in Egg Diameter Over Time
Egg diameter measurements provided a complementary perspective to mass changes, visually confirming osmotic effects. Initially, all eggs had relatively similar diameters, establishing a control. Over the duration of the experiment, eggs in hypotonic solutions demonstrably increased in diameter. This swelling occurred as water influx expanded the egg’s membrane, reflecting the osmotic pressure.
Conversely, eggs in hypertonic solutions exhibited a decrease in diameter, becoming visibly shrunken. Water loss caused the membrane to contract. The rate of diameter change, like mass, wasn’t constant, slowing as solutions approached equilibrium. Consistent measurement techniques, using calipers for precision, were vital. These diameter changes, alongside mass data, offered a comprehensive understanding of osmosis’s impact on cellular volume.
Observations of Egg Appearance
Visual inspection of the eggs throughout the experiment revealed striking changes correlating with osmotic pressure. Eggs immersed in distilled water became noticeably more translucent and swelled considerably, appearing almost water-filled. Conversely, eggs placed in higher sucrose concentrations exhibited increasing opacity and shrinkage. The membrane became visibly taut and wrinkled as water exited the egg.
Color changes were subtle but present; eggs in hypertonic solutions appeared slightly darker. The membrane’s integrity was consistently monitored for any signs of rupture, particularly in hypotonic conditions due to expansion. These qualitative observations, documented with photographs, provided valuable context to the quantitative data, illustrating the dramatic effects of osmosis on cellular structure and appearance.
Data Analysis
Statistical analysis of mass and diameter changes, alongside percentage calculations, reveals osmotic effects. Graphical representations, like charts, clearly illustrate concentration-dependent trends.
Calculating Percentage Change in Mass
Determining the percentage change in egg mass is crucial for quantifying osmosis. This calculation reveals how much water moved into or out of the egg due to differing solute concentrations. The formula employed is: [(Final Mass ⎻ Initial Mass) / Initial Mass] x 100%. A positive percentage indicates water influx, swelling the egg, while a negative value signifies water efflux, causing shrinkage.
Accurate initial and final mass measurements are paramount for reliable results. Consistent units (grams) must be used throughout the calculation. This percentage change directly correlates with the osmotic potential difference between the egg’s interior and the surrounding sucrose solution. Analyzing these changes across various concentrations provides a clear understanding of osmotic behavior, forming a key component of the lab report’s analysis.
Calculating Percentage Change in Diameter
Assessing the percentage change in egg diameter complements mass measurements, providing a holistic view of osmotic effects. This calculation, similar to mass change, quantifies the egg’s dimensional alteration due to water movement. The formula is: [(Final Diameter ⎼ Initial Diameter) / Initial Diameter] x 100%. A positive percentage signifies swelling, while a negative value indicates shrinkage.
Precise diameter measurements, ideally using calipers, are essential. Consistent units (millimeters or centimeters) are vital. This percentage change directly reflects the egg’s response to the osmotic gradient. Correlating diameter changes with mass changes strengthens the analysis, revealing how osmosis impacts both weight and size, and is a critical part of the lab report’s findings.
Graphical Representation of Data
Visualizing the data through graphs is crucial for a comprehensive egg osmosis lab report. Line graphs effectively illustrate changes in egg mass and diameter over time for each sucrose concentration. The x-axis typically represents time (in hours or days), while the y-axis displays either mass (in grams) or diameter (in millimeters/centimeters).
Multiple lines, each representing a different sucrose concentration, allow for direct comparison of osmotic effects. Bar graphs can summarize percentage changes in mass and diameter at the experiment’s conclusion. Clear labeling of axes, a descriptive title, and a legend are essential for clarity. These visuals enhance understanding and support the report’s conclusions, making the results easily interpretable.
Discussion
Osmotic effects observed directly correlate with sucrose concentration gradients, influencing water movement across the egg’s membrane, impacting both mass and size.
Explanation of Osmotic Effects
Osmosis, fundamentally, is the movement of water across a semi-permeable membrane from a region of high water potential to a region of low water potential. In this experiment, the deshelled egg acts as a model cell, with its membrane being selectively permeable. When the egg is immersed in a hypertonic solution (high sucrose concentration), water moves out of the egg, causing it to shrink and lose mass; Conversely, a hypotonic solution (low sucrose concentration) causes water to move into the egg, leading to swelling and mass gain.
The observed changes in egg mass and diameter directly reflect this water movement. The magnitude of these changes is proportional to the difference in water potential between the egg’s interior and the surrounding solution. Understanding these principles is crucial for interpreting the experimental results and drawing valid conclusions about osmotic pressure and cellular behavior.
Relationship Between Sucrose Concentration and Osmosis
The sucrose concentration directly dictates the rate and direction of osmosis. Higher sucrose concentrations create a stronger osmotic gradient, accelerating water movement out of the egg – a hypertonic environment. Lower concentrations result in slower water influx, creating a hypotonic environment. This relationship is not linear; the difference in water potential, not just the absolute concentration, drives osmosis.
Our observations demonstrate that as sucrose concentration increased, egg mass decreased more significantly, and diameter reduced. Conversely, lower sucrose levels led to increased mass and diameter. This confirms the inverse correlation between sucrose concentration and water movement across the egg membrane, illustrating the fundamental principles of osmotic pressure and its impact on cellular volume.
Egg osmosis clearly showed sucrose concentration’s effect on water movement across a membrane, validating osmosis principles and highlighting potential experimental inaccuracies.

Our investigation into egg osmosis revealed a compelling correlation between the sucrose concentration of the surrounding solution and the resulting changes in egg mass and diameter. Eggs immersed in hypotonic solutions (lower sucrose concentration) consistently gained mass and increased in size due to water influx, demonstrating osmosis. Conversely, eggs placed in hypertonic solutions (higher sucrose concentration) experienced a decrease in both mass and diameter as water moved out of the egg.
These observations strongly support the principle that water travels across a semi-permeable membrane – in this case, the egg’s membrane – from areas of high water potential to areas of low water potential. The magnitude of these changes was directly proportional to the difference in sucrose concentration, confirming the quantitative relationship predicted by osmotic theory. The experiment successfully visualized and quantified this crucial biological process.
Potential Sources of Error
Several factors could have introduced error into our egg osmosis experiment. Inconsistent deshelling of the eggs, leading to varying membrane thicknesses, is a possibility. Slight inaccuracies in initial mass and diameter measurements, despite careful technique, could also contribute to discrepancies. Temperature fluctuations during the experiment might have affected the rate of osmosis, as temperature influences molecular movement.
Furthermore, the subjective nature of observing egg appearance introduces potential bias. Ensuring complete immersion of the eggs and preventing solution evaporation were challenges. Finally, assuming the egg membrane is perfectly semi-permeable is a simplification; some solute movement may have occurred. Addressing these limitations in future experiments through stricter controls and more precise instrumentation would enhance data reliability.